I came across a blog post today over at Dash of Insight. Normally, I enjoy checking in with Jeff’s thoughts here and there but today I have to take issue with something.
In “expensive misconceptions,” he likens a chart of John Hussman’s with things like the Baltic Dry Index and the Hindenburg Omen ultimately concluding these are all nothing more than opportunities for investors to indulge in confirmation bias.
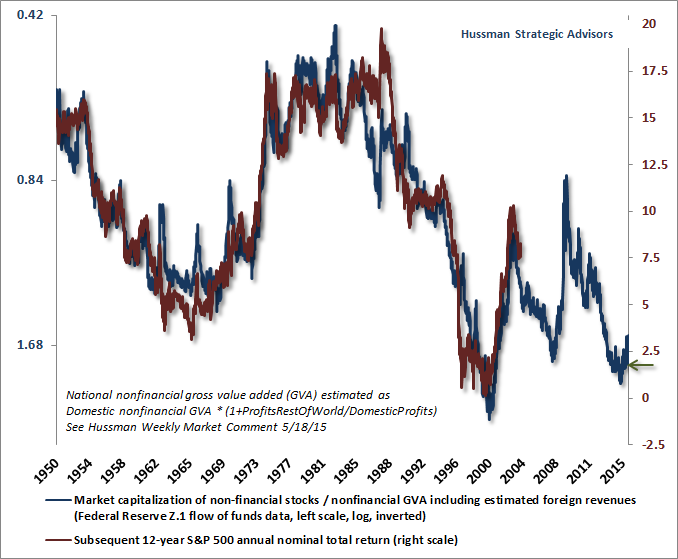
Specifically, he takes issue with the chart in question (above) by writing:
“I have a simple question for you: Could you step up in front of a group of people and explain this chart? If not, why do you believe it? A smart and influential guy presents something that you cannot really evaluate. Why is this a sound basis for your decisions?”
In other words, because “you” (read “he”?) can’t explain the chart, it is simply not valid. To be clear, Jeff makes no attempt to even understand the chart or the concept behind it let alone pose any counterargument to it at all, at least not anywhere in this post.
So let me help him out here by explaining it. This chart is a visual representation of Warren Buffett’s famous words: “The price you pay determines your rate of return.” In fact, this chart is a very close cousin to what Buffett has called, “the best single measure of where valuations stand at any given moment.” That is, the total value of the equity market in relation to GNP, essentially a price-to-sales ratio for the broad stock market.
It’s very simple, actually. When investors have paid high prices in the past, as indicated by the total value of the country’s equities relative to the country’s economic output (including foreign sales generated by domestic companies – one popular critique of the Buffett Yardstick is that it doesn’t account for this), they have received meager and even negative returns over long periods of time, as indicated by the forward 12-year returns on the chart. Conversely, when investors have been able to buy stocks at relatively low valuations, their returns have been very good over the following decade or more.
Furthermore, this negative correlation between valuations and forward returns is statistically very high (greater than -90%) and backed by 65 years worth of data. The Buffett Yardstick, as Hussman demonstrates, has been nearly as good as his own version at forecasting forward returns and is backed by roughly 90 years worth of data. Both charts, and the data and reasoning behind them, clearly demonstrate and validate the concept that, “the price you pay determines your rate of return.”
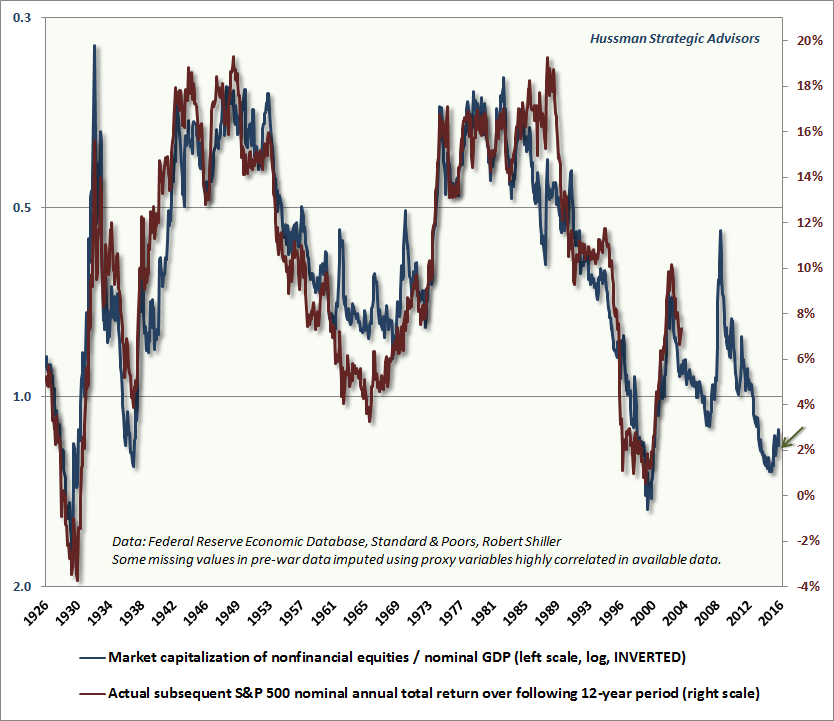
The only “expensive misconception” here is failing to understand this iron “law of valuation,” as Hussman calls it. Investors who are willing to believe they should reasonably expect wonderful returns regardless of the price they pay will inevitably be introduced to this law over the course of their investing lifetime, as countless others have been in the past. Just ask anyone who bought stocks in 1929, 1937 or 2000, the last three times stocks reached current valuation extremes, according to the Buffett Yardstick.
Finally, I find it terrifically ironic, and perhaps enlightening from a sentiment standpoint, to see Jeff end the piece with this:
“The insightful investor fights spin with data and analysis.”
Because, at least in this instance, it appears he’s fighting robust data and analysis with nothing but spin. In fact, Jeff may be indulging in a bit of confirmation bias of his own:
Confirmation bias, also called confirmatory bias or myside bias, is the tendency to search for, interpret, favor, and recall information in a way that confirms one’s preexisting beliefs or hypotheses, while giving disproportionately less consideration to alternative possibilities. -Wikipedia
“Less consideration to alternative possibilities”? How about none at all?