
In my last piece, I openly worried about a few very smart investment minds who have recently attempted to rationalize or justify the persistently high equity valuations we have seen over the past 25 years. I don’t believe that, “it’s different this time.” The modern economy doesn’t have any new magical component that makes a standard stream of cash flows any more valuable than they were 50 or 100 years ago. Nor have investors become generally more intelligent.
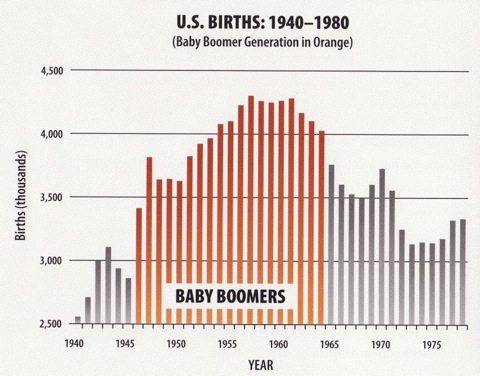
I think there’s a very simple explanation for the high stock market valuations since 1990: demographics. From 1981-2000, the baby boom generation came into their peak earning and investing years. Is it just coincidence that during that very same time we witnessed the largest stock market valuation bubble in history? No. In fact, there is a statistically significant correlation between demographic shifts like this and stock market valuations.
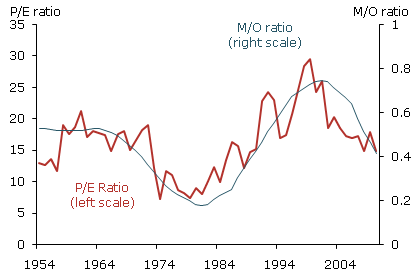
A few years ago a pair of research advisors to the Federal Reserve Bank of San Francisco demonstrated this link. They found that demographics (specifically, the ratio between retirement age workers to peak earning and investing age ones) is responsible for 61% of the changes in the price-to-earnings ratio of the stock market over time. Additionally, they found that when their model’s forecast p/e was off by a significant amount the real p/e consistently reverted to their forecast p/e.

All this means is that there is a very strong relationship between the size of the generation that is currently in its peak earnings and investing years and the valuation of the stock market. Over the past 25 years we have seen the single largest generation in our nation’s history, the baby boomers, push stock market valuations higher than they have ever been. It’s not magic; it’s simple supply and demand (mainly demand).
According to this theory, for valuations to remain elevated the stock market needs the generations that follow the baby boomers to maintain the same population growth that the baby boom represented. We already know that this just isn’t going to happen. The generation following the baby boomers, Generation X, represents a significant deceleration in population growth. For this reason, this model forecasts a contraction of the price-to-earnings ratio over the next decade, from about 18 last year to roughly 8 in 2025.

In a piece from last December, I assumed an earnings growth rate of 3.8% over the coming decade, the historical average according to Robert Shiller, in forecasting 2025 earnings for the S&P 500 of 156.76. Apply an 8.23 p/e (forecast by the model) and you get a price level for the index of 1,290.
However, Cliff Asness has shown that earnings are very highly correlated with the level of inflation. With 10-year TIPS now implying inflation of less than 2% we can make a new earnings forecast using that as our assumed level of earnings growth. In this case, we arrive at a 2025 earnings number of 131.75. Applying an 8.23 multiple we get a price level for the index of 1,084. This would represent a decline of about 50% over the coming decade, a truly horrific prospect.
Ned Davis Research has also studied this relationship and come to a similar conclusion. The chart below comes from Davis’ terrific book, “Being Right or Making Money.”
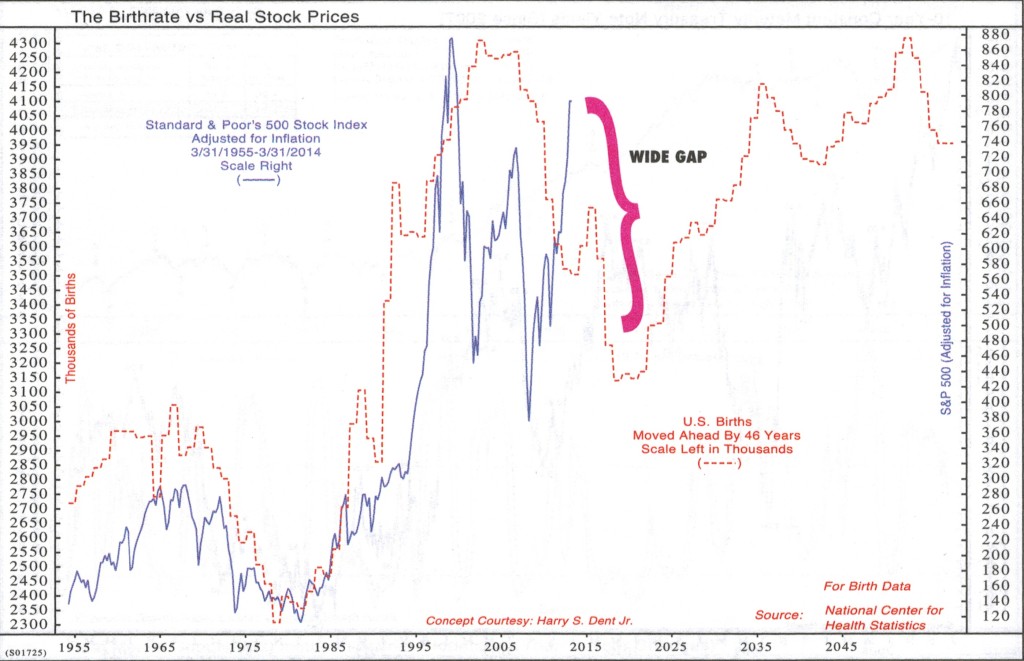
Of course, there are many factors that influence stock prices and valuations over time and demographics is just one of them. But it’s the only one I’ve found that convincingly explains the persistently high valuations we have seen since the 1990’s. And it doesn’t support the idea that high valuations are here to stay, as some may believe. In fact, it suggests just the opposite.