Art Cashin: Stocks could be forming a "formidable" head and shoulders top http://t.co/lg7WOGZSSo $SPY $SPX
— Jesse Felder (@jessefelder) February 13, 2014
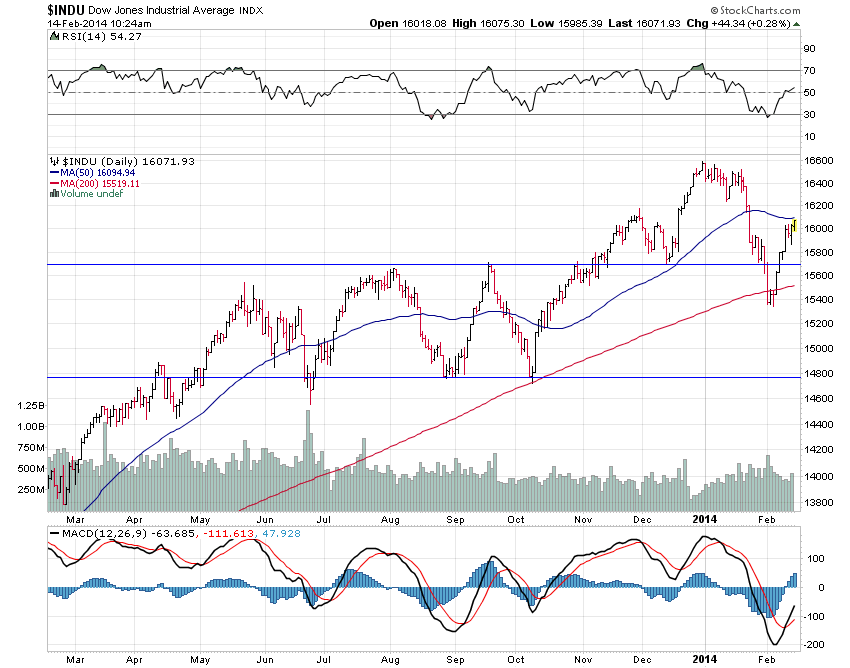
Wednesday I tweeted an interview with Art Cashin in which he discusses the “formidable” head and shoulders pattern setting up in the Dow. He also mentions how it correlates to the “scary” 1929 chart being passed around trading desks right now (see “Don’t Dismiss The Possibility Of A Stock Market Crash“).
As you can see in the chart below the index has rallied right up to the underside of its 50-day moving average and could be setting up the right shoulder of a head and shoulders top:
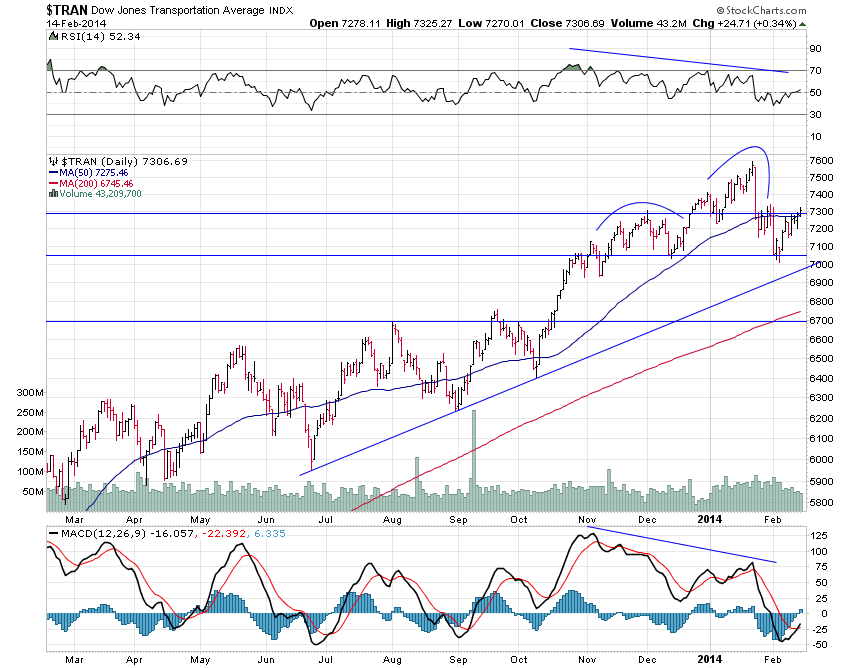
On a shorter time frame, it’s clear to see that despite the recent strength the Dow has failed to overcome its 61.8% Fibonacci retracement level. In addition, prices are making a new high today even though MACD has already crossed down setting up a divergence:
This is the moment of truth. If the 1929 analogue is to remain valid prices need to reverse right here right now. To be clear, Tom DeMark, when he first introduced the analogue, made it clear it was for “entertainment purposes” only. I don’t believe he is “fear-mongering” at all – neither do I intend to do so. Fibonacci and fractal analysis is something I find truly fascinating and this is a real time example of how it applies to the markets.